

| FAQ |
| Calendar |

|
|
|||||||


| Networking & Communications Tempat menjual alat untuk jaringan seperti hub, switch, router dan lainnya |
 |
|
|
Listing Tools |
|
#1
 7th December 2011
|
||||
|
||||
|
Kondisi: Baru Harga (Rp): 600000 Lokasi: Jawa Timur JASA SETTING MIKROTIK // PROXY SERVER // WTS MIKROTIK ROUTERBOARD >> LONG TERM SUPPORT UNTUK SEMUA SETTINGAN <<  BUNDLING DENGAN ADVANCE QoS LEVEL 1
Harga : RB750 @ Rp 600.000 Harga : RB450 @ Rp 975.000 Harga : RB750G @ Rp 850.000 Semua harga di atas sudah termasuk Hardware, Settingan dan Biaya kirim seluruh pulau jawa. BUNDLING DENGAN ADVANCE QoS LEVEL 2 + DUAL WAN
Harga : RB750 @ Rp 800.000 Harga : RB450 @ Rp 1.375.000 Harga : RB750G @ Rp 1.000.000 Semua harga di atas sudah termasuk Hardware, Settingan dan Biaya kirim seluruh nusantara. JUGA MELAYANI INSTALASI DAN OPTIMASI UNTUK
Spoiler for Harga Detail:
Untuk semua pembelian paket All In One, biaya kirim FREE untuk seluruh nusantara ( Paket Lain - Lain ) - User Manager / Hotspot Setup = Rp 300.000 - Optimizing Proxy / Installation = Rp 500.000 - Linux Router ( HTB / Web HTB ) = Rp 500.000 - DNS Server Optimization ( Bind9 / Unbound ) = Rp 300.000 - Network Monitoring + 24 Hour Troubleshooting = Call * Harga sewaktu - waktu dapat berubah * Dual WAN = Traffic Divider Only ( IIX / International / Game Traffic ) Non Load Balancing Spoiler for Gallery Mikrotik RouterBoard:
NGE-LAG HILANG, BROWSING LANCAR, DOWNLOAD BAHAGIA !!! Hubungi Kami di : FB : http://www.facebook.com/netsi21 <- Detail Price List YM : netsi21_surabaya / andrean_wj2007 GTalk : jasasettingrouter skype : njs-21 Phone : 031-60400681  HARGA DI LUAR BUDGET ?? SCROLL KE BAWAH  Terkait:

|
|
#2
7th December 2011
|
||||
|
||||
|
PAKET HEMAT! MULAI DARI Rp 499.999 SAJA GAN !! Spoiler for Feature:
Spoiler for Perhatian!:
Spoiler for Harga!:
|
|
#3
7th December 2011
|
||||
|
||||
|
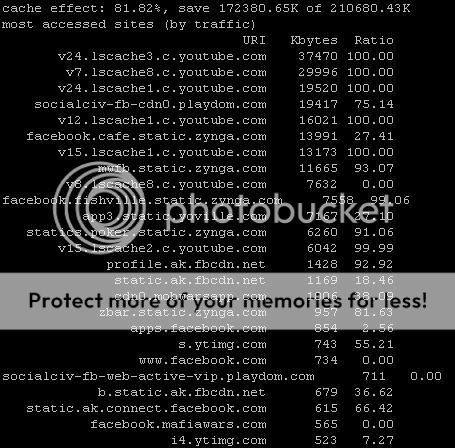
BANDWIDTH SAVER DENGAN WEB CACHE
   Code:
Start Time:     Sun, 19 Dec 2010 02:31:02 GMT
Current Time:   Sun, 19 Dec 2010 05:28:48 GMT
Connection information for squid:
        Number of clients accessing cache:      0
        Number of HTTP requests received:       77483
        Number of ICP messages received:        0
        Number of ICP messages sent:    0
        Number of queued ICP replies:   0
        Request failure ratio:   0.00
        Average HTTP requests per minute since start:   435.9
        Average ICP messages per minute since start:    0.0
        Select loop called: 2915284 times, 3.659 ms avg
Cache information for squid:
        Request Hit Ratios:     5min: 25.7%, 60min: 29.3%
        Byte Hit Ratios:        5min: 7.8%, 60min: 12.9%
        Request Memory Hit Ratios:      5min: 3.8%, 60min: 4.7%
        Request Disk Hit Ratios:        5min: 64.0%, 60min: 68.7%
        Storage Swap size:      25258936 KB
        Storage Mem size:       8204 KB
        Mean Object Size:       35.87 KB
        Requests given to unlinkd:      0
Median Service Times (seconds)  5 min    60 min:
        HTTP Requests (All):   0.35832  0.35832
        Cache Misses:          0.44492  0.61549
        Cache Hits:            0.01164  0.00091
        Near Hits:             0.32154  0.35832
        Not-Modified Replies:  0.00000  0.00000
        DNS Lookups:           0.00000  0.00000
        ICP Queries:           0.00000  0.00000
Resource usage for squid:
        UP Time:        10666.242 seconds
        CPU Time:       157.054 seconds
        CPU Usage:      1.47%
        CPU Usage, 5 minute avg:        1.66%
        CPU Usage, 60 minute avg:       1.29%
        Process Data Segment Size via sbrk(): 107256 KB
        Maximum Resident Size: 444080 KB
        Page faults with physical i/o: 1
Memory usage for squid via mallinfo():
        Total space in arena:  107768 KB
        Ordinary blocks:       105935 KB      0 blks
        Small blocks:               0 KB      0 blks
        Holding blocks:             0 KB      0 blks
        Free Small blocks:       1736 KB
        Free Ordinary blocks:      96 KB
        Total in use:          105935 KB 98%
        Total free:              1832 KB 2%
        Total size:            107768 KB
Memory accounted for:
        Total accounted:        66287 KB
        memPoolAlloc calls: 15248011
        memPoolFree calls: 13679770
File descriptor usage for squid:
        Maximum number of file descriptors:   8192
        Largest file desc currently in use:    321
        Number of file desc currently in use:  260
        Files queued for open:                   0
        Available number of file descriptors: 7932
        Reserved number of file descriptors:   100
        Store Disk files open:                   3
        IO loop method:                     epoll
Internal Data Structures:
        704946 StoreEntries
          1418 StoreEntries with MemObjects
          1401 Hot Object Cache Items
        704182 on-disk objects
Code:
Start Time:     Sat, 18 Dec 2010 07:43:14 GMT
Current Time:   Mon, 20 Dec 2010 13:56:59 GMT
Connection information for squid:
        Number of clients accessing cache:      0
        Number of HTTP requests received:       1143915
        Number of ICP messages received:        0
        Number of ICP messages sent:    0
        Number of queued ICP replies:   0
        Request failure ratio:   0.00
        Average HTTP requests per minute since start:   351.6
        Average ICP messages per minute since start:    0.0
        Select loop called: 12693744 times, 15.380 ms avg
Cache information for squid:
        Request Hit Ratios:     5min: 14.4%, 60min: 18.9%
        Byte Hit Ratios:        5min: 22.9%, 60min: 25.3%
        Request Memory Hit Ratios:      5min: 0.0%, 60min: 0.6%
        Request Disk Hit Ratios:        5min: 83.3%, 60min: 88.9%
        Storage Swap size:      15633188 KB
        Storage Mem size:       8220 KB
        Mean Object Size:       24.24 KB
        Requests given to unlinkd:      0
Median Service Times (seconds)  5 min    60 min:
        HTTP Requests (All):   0.42149  0.35832
        Cache Misses:          0.49576  0.42149
        Cache Hits:            0.01648  0.01387
        Near Hits:             0.30459  0.52331
        Not-Modified Replies:  0.00000  0.00000
        DNS Lookups:           0.00000  0.00000
        ICP Queries:           0.00000  0.00000
Resource usage for squid:
        UP Time:        195224.704 seconds
        CPU Time:       1470.308 seconds
        CPU Usage:      0.75%
        CPU Usage, 5 minute avg:        0.39%
        CPU Usage, 60 minute avg:       0.21%
        Process Data Segment Size via sbrk(): 93648 KB
        Maximum Resident Size: 388464 KB
        Page faults with physical i/o: 1
Memory usage for squid via mallinfo():
        Total space in arena:   94288 KB
        Ordinary blocks:        89649 KB      0 blks
        Small blocks:               0 KB      0 blks
        Holding blocks:             0 KB      0 blks
        Free Small blocks:       3382 KB
        Free Ordinary blocks:    1256 KB
        Total in use:           89649 KB 95%
        Total free:              4638 KB 5%
        Total size:             94288 KB
Memory accounted for:
        Total accounted:        53015 KB
        memPoolAlloc calls: 97857588
        memPoolFree calls: 96529918
File descriptor usage for squid:
        Maximum number of file descriptors:   8192
        Largest file desc currently in use:    158
        Number of file desc currently in use:  156
        Files queued for open:                   0
        Available number of file descriptors: 8036
        Reserved number of file descriptors:   100
        Store Disk files open:                   0
        IO loop method:                     epoll
Internal Data Structures:
        645807 StoreEntries
          1670 StoreEntries with MemObjects
          1654 Hot Object Cache Items
        644850 on-disk objects
Code:
Start Time:     Thu, 23 Dec 2010 09:59:06 GMT
Current Time:   Sun, 26 Dec 2010 02:47:35 GMT
Connection information for squid:
        Number of clients accessing cache:      0
        Number of HTTP requests received:       197036
        Number of ICP messages received:        0
        Number of ICP messages sent:    0
        Number of queued ICP replies:   0
        Request failure ratio:   0.00
        Average HTTP requests per minute since start:   50.7
        Average ICP messages per minute since start:    0.0
        Select loop called: 4407930 times, 52.929 ms avg
Cache information for squid:
        Request Hit Ratios:     5min: 80.4%, 60min: 69.5%
        Byte Hit Ratios:        5min: 95.3%, 60min: 75.7%
        Request Memory Hit Ratios:      5min: 0.0%, 60min: 1.1%
        Request Disk Hit Ratios:        5min: 72.2%, 60min: 70.3%
        Storage Swap size:      29964396 KB
        Storage Mem size:       8176 KB
        Mean Object Size:       27.78 KB
        Requests given to unlinkd:      0
Median Service Times (seconds)  5 min    60 min:
        HTTP Requests (All):   0.00000  0.03066
        Cache Misses:          0.52331  0.55240
        Cache Hits:            0.00000  0.00000
        Near Hits:             0.28853  0.28853
        Not-Modified Replies:  0.00000  0.00000
        DNS Lookups:           0.00000  0.00000
        ICP Queries:           0.00000  0.00000
Resource usage for squid:
        UP Time:        233308.948 seconds
        CPU Time:       329.180 seconds
        CPU Usage:      0.14%
        CPU Usage, 5 minute avg:        0.14%
        CPU Usage, 60 minute avg:       0.28%
        Process Data Segment Size via sbrk(): 155076 KB
        Maximum Resident Size: 0 KB
        Page faults with physical i/o: 0
Memory usage for squid via mallinfo():
        Total space in arena:  151492 KB
        Ordinary blocks:       149215 KB      0 blks
        Small blocks:               0 KB      0 blks
        Holding blocks:             0 KB      0 blks
        Free Small blocks:       1552 KB
        Free Ordinary blocks:     724 KB
        Total in use:          149215 KB 98%
        Total free:              2276 KB 2%
        Total size:            151492 KB
Memory accounted for:
        Total accounted:        97650 KB
        memPoolAlloc calls: 33921373
        memPoolFree calls: 31438493
File descriptor usage for squid:
        Maximum number of file descriptors:   8192
        Largest file desc currently in use:    105
        Number of file desc currently in use:   29
        Files queued for open:                   0
        Available number of file descriptors: 8163
        Reserved number of file descriptors:   100
        Store Disk files open:                   0
        IO loop method:                     epoll
Internal Data Structures:
        1079192 StoreEntries
          1524 StoreEntries with MemObjects
          1522 Hot Object Cache Items
        1078816 on-disk objects
   Bukti lain bisa di lihat di fan page kami disini
|
|
|
|


